
wlan heatmap – Wi-Fi Coverage Map with Acrylic Wi-Fi Heatmaps
Generating a Wi-Fi coverage map, or wlan heatmap, requires a previous site survey to measure wireless network parameters at different locations within the area of interest. Using Acrylic Wi-Fi Heatmaps, these measurements can be performed without knowing which type of Wi-Fi access points were deployed within the coverage area, allowing for the analysis of extensive geographical areas.
Once the first measurements are performed, the raw data collected from each access point is processed to generate different types of Wi-Fi maps, including coverage maps, adding value to a Wi-Fi site survey by analyzing signal strength and helping determine wireless network performance and Wi-Fi network coverage range. 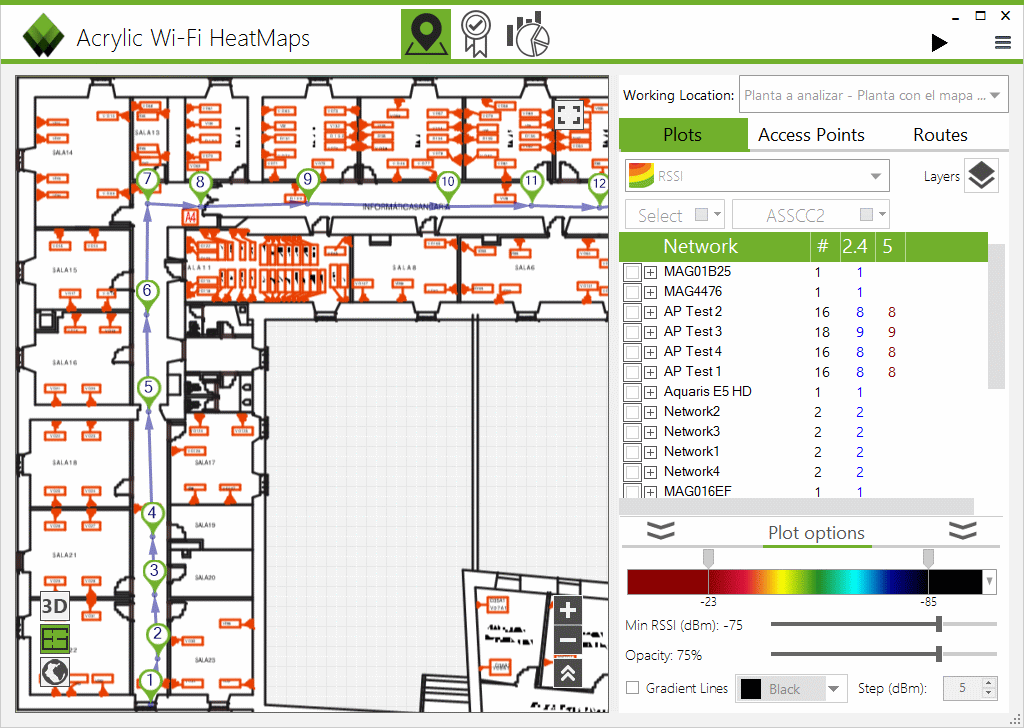 Data collected during the site survey is processed using different interpolation algorithms to create a representation, as accurate as possible, of signal behavior within the analyzed range. This information can be visualized in real time as a Wi-Fi map.
Wi-Fi signal strength map generation functionalities apply to both 2.4Ghz and 5Ghz networking standards, and they can be visualized over building blueprints, as well as satellite maps, while performing a Wi-Fi site survey. Acrylic Wi-Fi Heatmaps automatically generates more than 11 types of Wi-Fi coverage maps, being one of them the Wi-Fi coverage map, or heatmap.
Generating an wlan heatmap – Wi-Fi Coverage Map
A Wi-Fi coverage map, also known as wlan heatmap, shows (maximum) collective signal strength plot results for all selected access points. This map is often used in coverage surveys and it is automatically included in Wi-Fi coverage reports or it can be generated from the ‘Plot Results’ window.
Minimum signal level thresholds can be established to represent only those surveyed Wi-Fi signal strength measurements that are above the set threshold, for example, -75dbm, which is an excessively weak signal. 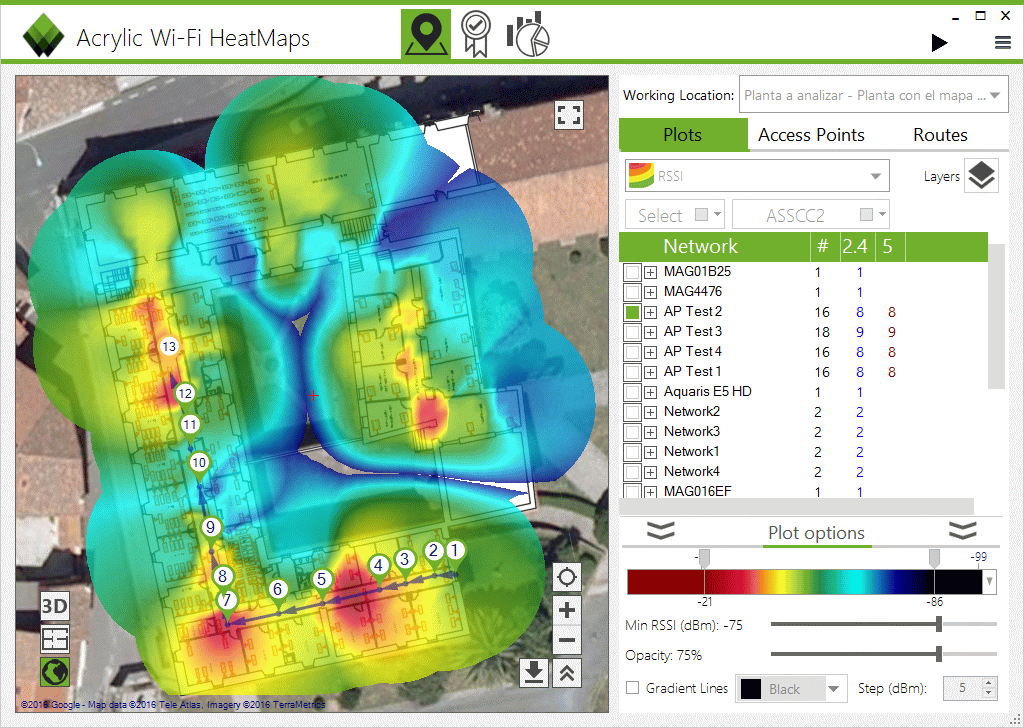 This coverage map allows you to see your Wi-Fi network coverage range for each access point within the analyzed area, and it also allows you to visualize Wi-Fi coverage from a single access point, as well as collective coverage from all access points combined within a certain area of interest.
By using Wi-Fi heatmaps, you will be able to adjust access point locations, or add additional access points to the coverage area for optimal Wi-Fi coverage. wlan Heatmaps can be grouped by SSID, displaying either complete coverage from all access points combined, or individual access point coverage.
Download the fully functional trial version of Acrylic Wi-Fi Heatmaps and start creating your Wi-Fi coverage maps.