Site survey project – Wi-Fi analysis at an airport
One of the most useful features of our Wi-Fi Heatmaps software when working on a Wi-Fi site survey project is its continuous mode. This mode allows you to quickly perform site survey Wi-Fi measurements, since the analyst only needs to click to define the starting point in the blueprint or map and then start walking at a constant low pace. Once the end point is reached, the new position is marked on the software interface. The software automatically arranges the performed wireless measurements along the selected path, significantly reducing the amount of time necessary to map a large area.
Many of our users have conducted their site survey projects in large outdoor areas, such as harbors or cattle fields, as well as indoor facilities, such as hospitals and shopping malls. Our Wi-Fi network analysis software can seamlessly perform thousands of measurements in any of these environments. Today you will learn how to use Acrylic Wi-Fi Heatmaps inside an airport to analyze a public Wi-Fi infrastructure deployment.
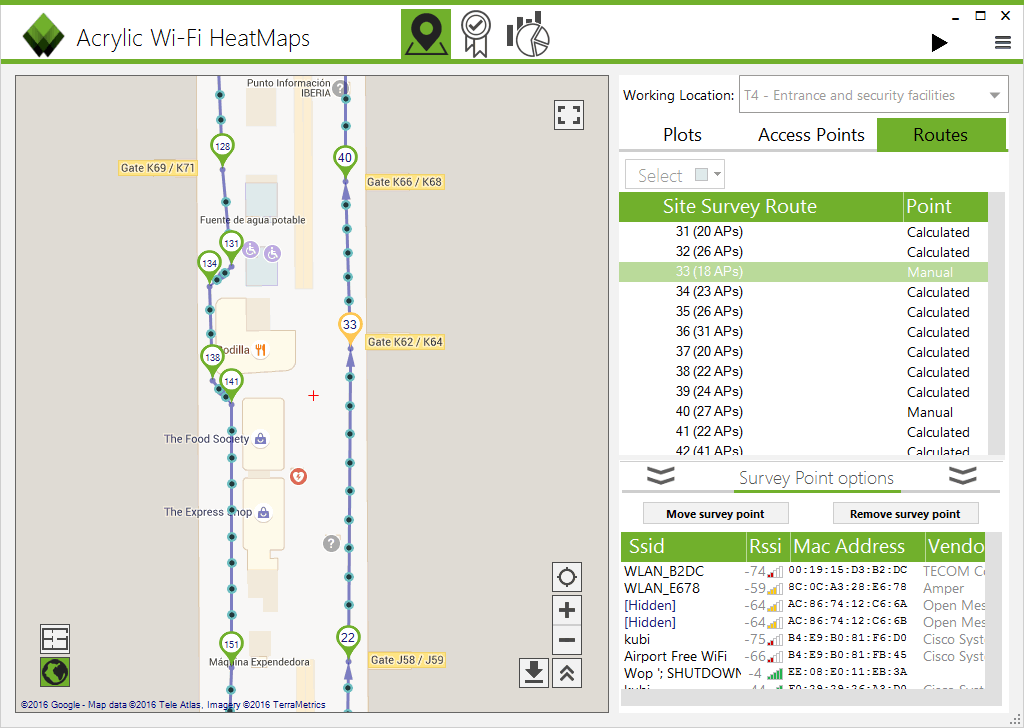
A Google satellite map, instead of a blueprint, was used for this site survey project. Using this map, which is available online, we have placed our tablet in an airport luggage cart to then push it along the terminal to start collecting measurement data from all airport Wi-Fi networks within range to complete our wireless network analysis. Although not required, measurements were performed using an Airpcap card. Only results for 2.4Ghz wireless bandwidth are shown.
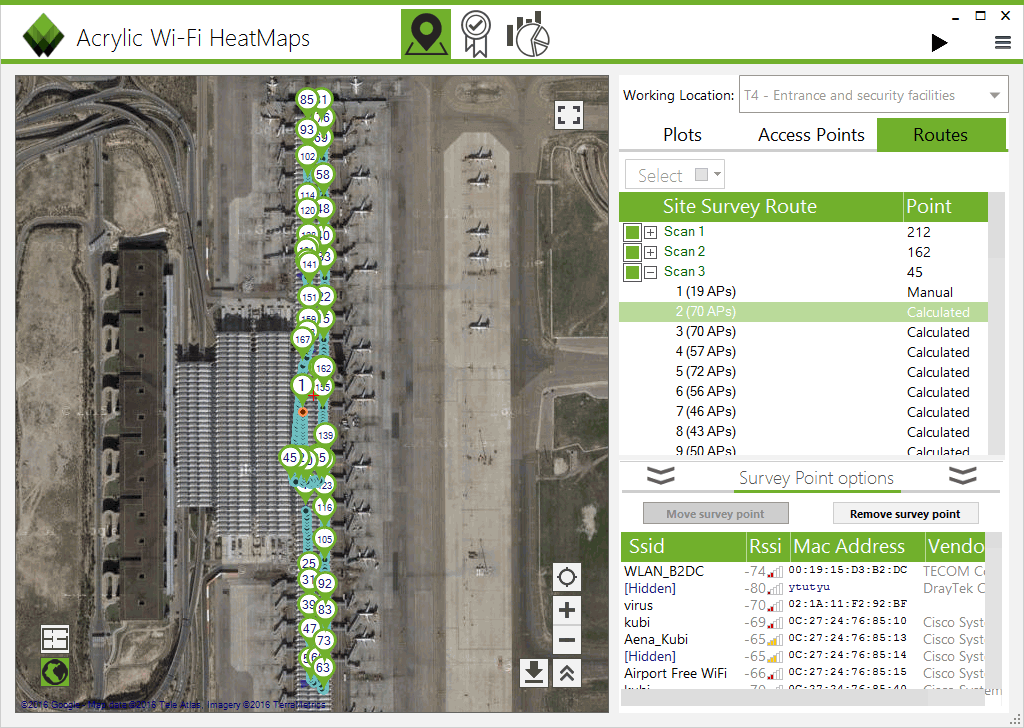
Thanks to the continuous mode, the number of possible interactions with the Wi-Fi network analysis software is virtually unlimited. Only 30 clicks on several checkpoints to mark our current positions as we were moving along were necessary for Heatmaps to take care of the rest of the work.
Continuous mode measurements have resulted in 419 virtual checkpoints stored by the software, which contain all the airport Wi-Fi measurements. After performing the measurements in just 20-minute time, the number of Cisco Wi-Fi access points that were identified serving the airport public network was 66.
Generating airport site survey project maps
From the software interface, we can automatically generate our site survey project maps for the Wi-Fi networks of our interest. As it has been discussed in our blog, the available maps include global Wi-Fi coverage, SNR, AP coverage, channel and channel overlapping, and client density maps. These maps can be generated over our site survey project and can be renderized in high resolution using a number of configurable parameters.
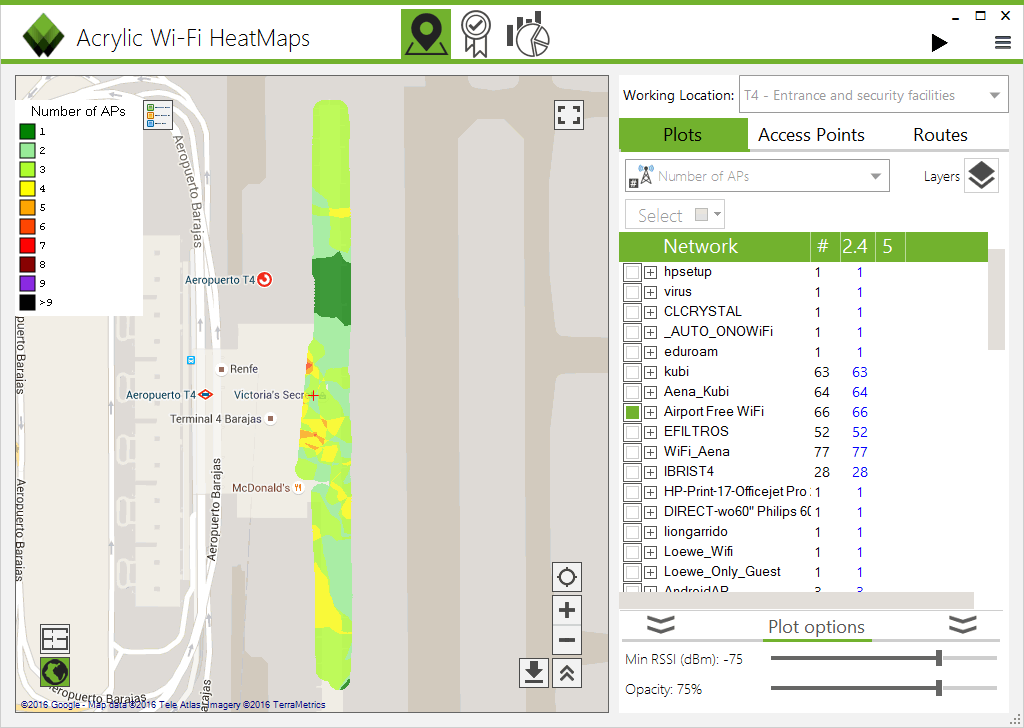
As you can expect, the airport Wi-Fi infrastructure has been, overall, correctly deployed. AP density is uniform, with no more than 2 overlapping signals on average in each area. Only at the terminal’s main entrance and exit areas, where the number of clients is higher and the building has two stories, there is a higher number of networks.
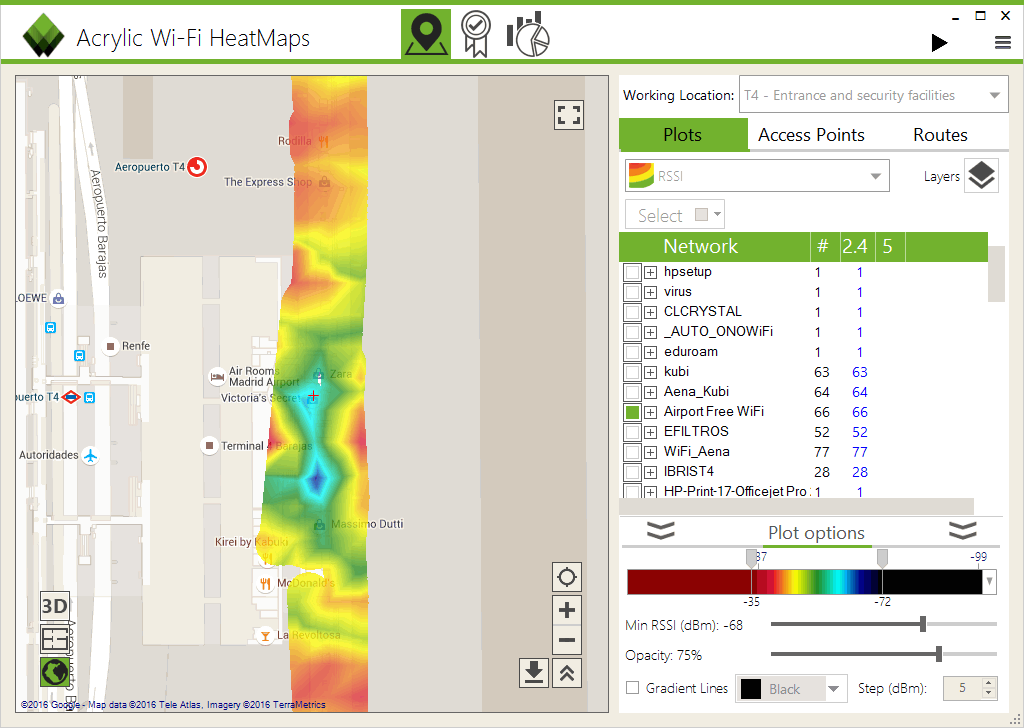
Wi-Fi signal strength observed is mainly uniform, providing an adequate signal strength between -35dbm and -65dmb in virtually every analyzed area, allowing for a good data transmission speed.
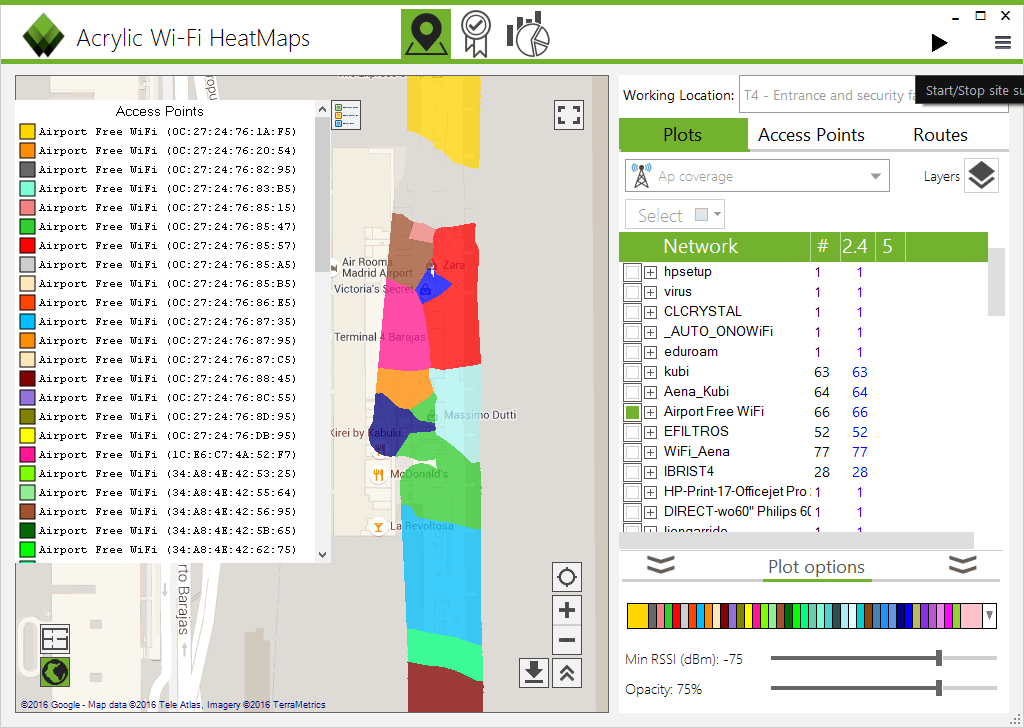
We have also included AP coverage results, indicating all the AP zones of influence in the airport.
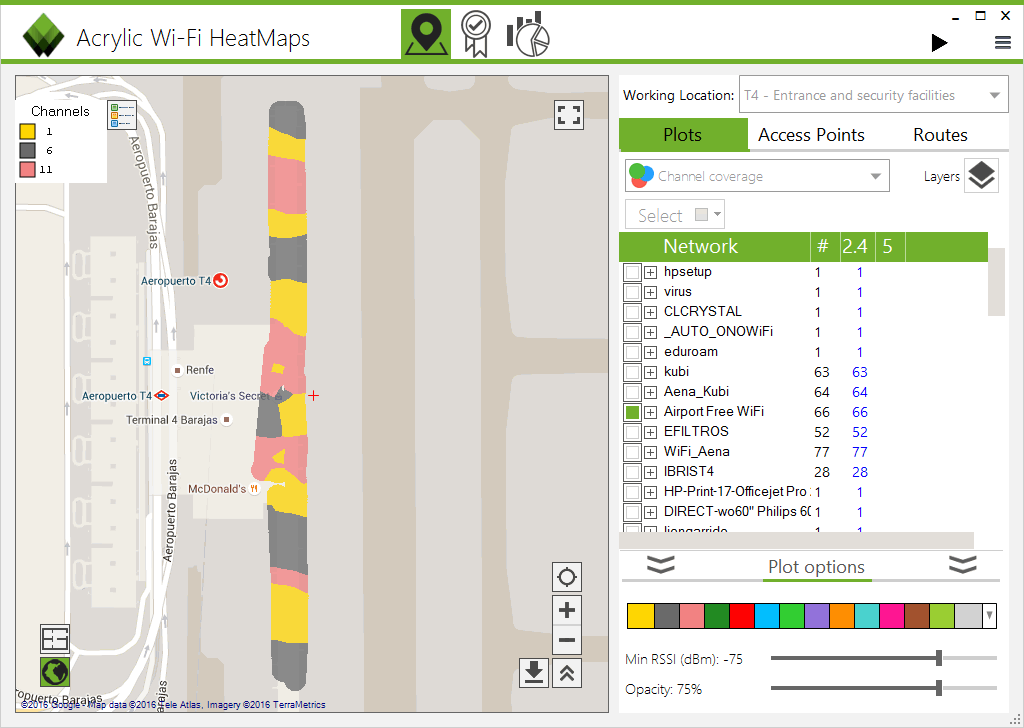
The map below shows the 2.4Ghz bandwidth channel distribution of the airport’s public wireless networks.
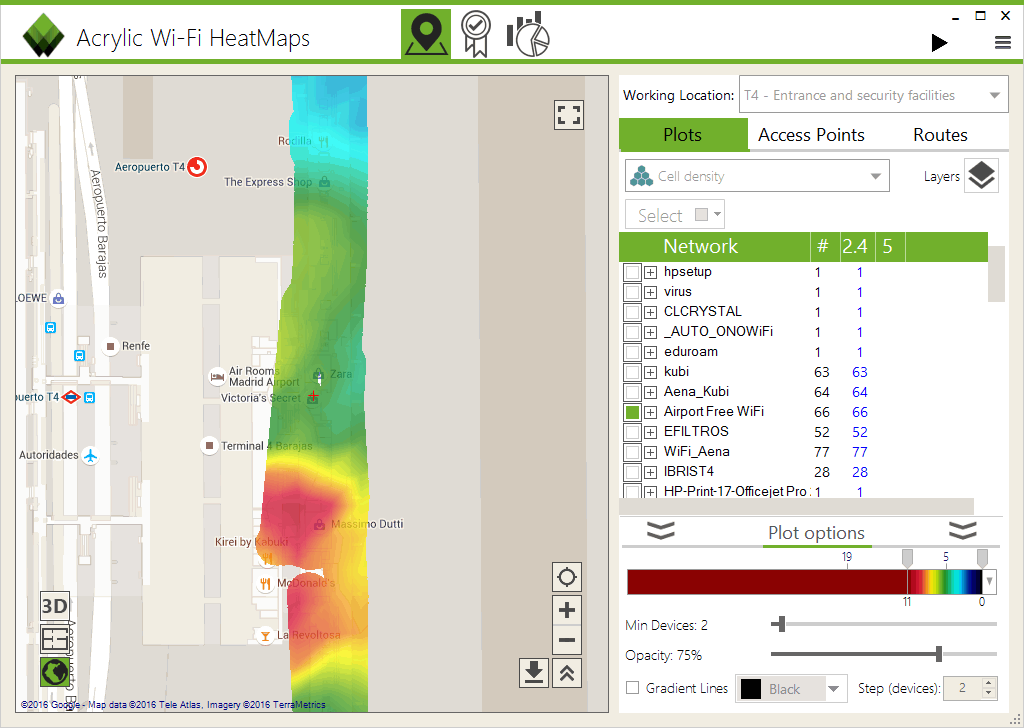
And last but not least, here is the client density or cell density map . Red zones indicate a higher number of Wi-Fi terminals, matching the location of the airport’s McDonald’s and Starbucks stores. As you can see, client density capabilities offer unmeasurable value to a site survey project, providing an important commercial information to companies.
The Wi-Fi site survey project creation process and the measurement procedures required to analyze the deployment of a Wi-Fi network infrastructure is an easy task when using Acrylic Wi-Fi Heatmaps. Get the fully functional free trial version valid for 15 days.

