Wifi analyzer, troubleshooting your WiFi from Windows
Table of Contents
Acrylic WiFi Analyzer is the perfect Windows wifi analyzer tool for troubleshooting wifi and to visualize your WiFi network current state. You can monitor the performance in real time, identify technical problems, and get recommendations on how to fix them. The tool is very valuable for both domestic and professional users.
Visualize the WiFi network state
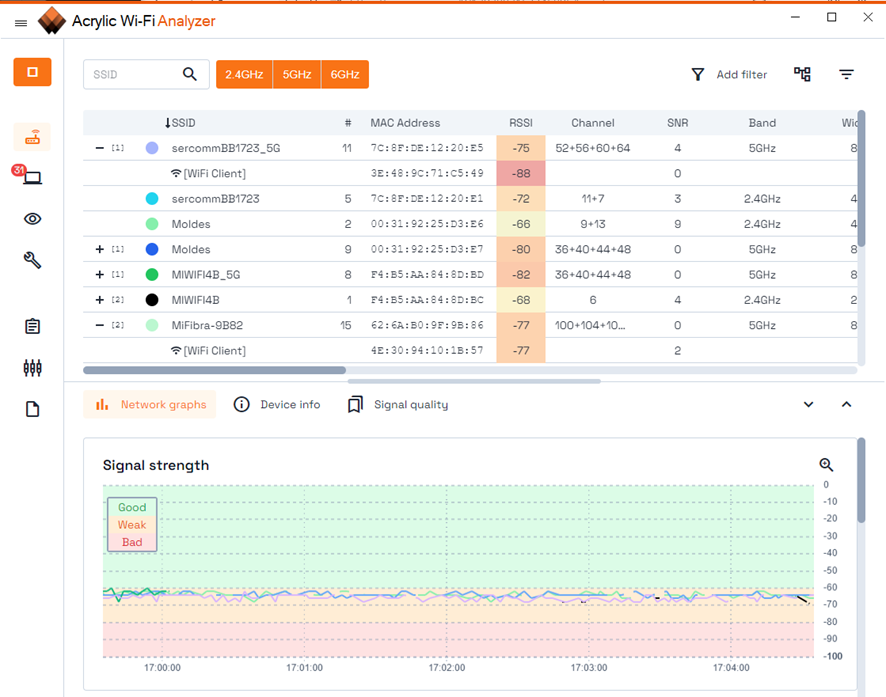
Right after starting the capture in Acrylic Wi-Fi Analyzer, you will get the list of all APs transmitting in your area. This list includes the most important characteristics for each AP such as SSID, MAC, RSSI, channels, and many more. If you are using one of the compatible WiFi adapters with monitor mode and you have installed the Acrylic wifi sniffer, you will also get the list of all connected devices for each AP, in addition to the SNR, the packet resending rate and more advanced metrics are very useful to know what is happening around you at the wifi level and perform a fast and efficient wifi troubleshooting.
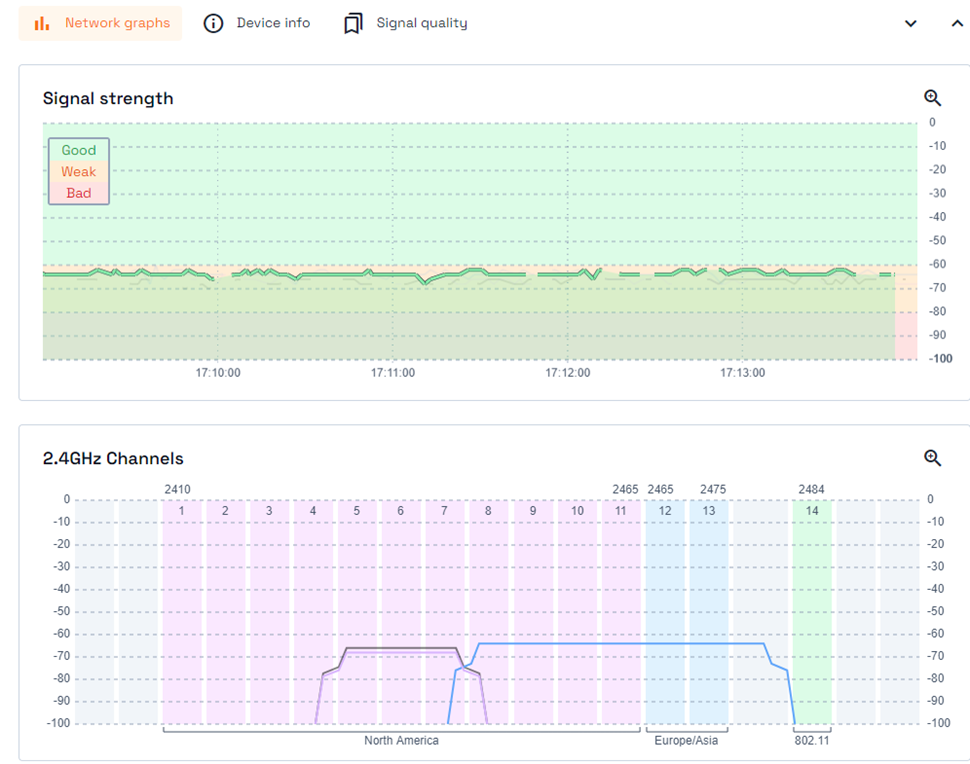
The bottom panel shows relevant graphs about the signal strength and channels used by APs on all frequency bands: 2.4 Ghz, 5 Ghz, and 6 Ghz (WIFI6E). These graphs are well known by WiFi professionals to spot co-channel and channel-adjacent interferences, as well as for detecting signal downtimes.
It is easy to obtain meaningful information about any device by clicking on the tab “Device Info”. If an AP is selected, the tab will show information about supported transfer rates, 802.11 standards, primary and secondary channel, max power level, and many more.
This information shows the maximum theoretical performance that an AP can provide.
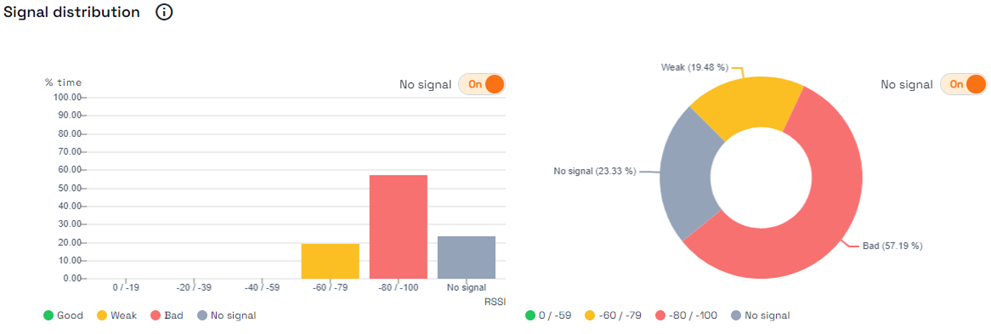
Within the same tab we also find another very useful graph: The signal distribution graph. This graph is meant to diagnose RSSI variations. Looking at the signal strength graph may not be enough. It can definitely provide important information during a specific timeframe, helping to get a sense of the overall average RSSI. However, the signal distribution graph showcases how stable the RSSI has been across time. This allows us to quantify the percentage of time a WiFi network is providing each RSSI level, from no signal to very good signal and evaluate if it is necessary to apply a wifi troubleshooting related to signal instability.
Get Recommendations to improve your WiFi network
The WiFi Analyzer for windows will measure the WiFi network quality using seven different metrics. Each one of those metrics will show a rating, allowing the user to easily spot where the problem is.
 A quick look at this summary will instantaneously inform users about where to invest their efforts in order to maximize their WiFi network performance.
The software provides insights about what is measuring each metric, why it is important, how can affect your WiFi network performance, and how you can fix it.
For instance, in the case of channel quality, the wifi analyzer will analyze all possible channels for a specific WiFi network and provide the best option based on network interferences (such as co-channel and adjacent channel interferences). Thanks to this recommendation, users can configure their WiFi networks to transmit in the right channel to get a boost on its performance.
Performance monitoring with a wifi analyzer for windows
The wifi troubleshooting section provides important information about the WiFi network, for this, a wifi analyzer for windows is really useful. Let’s dig in.
IP Addresses
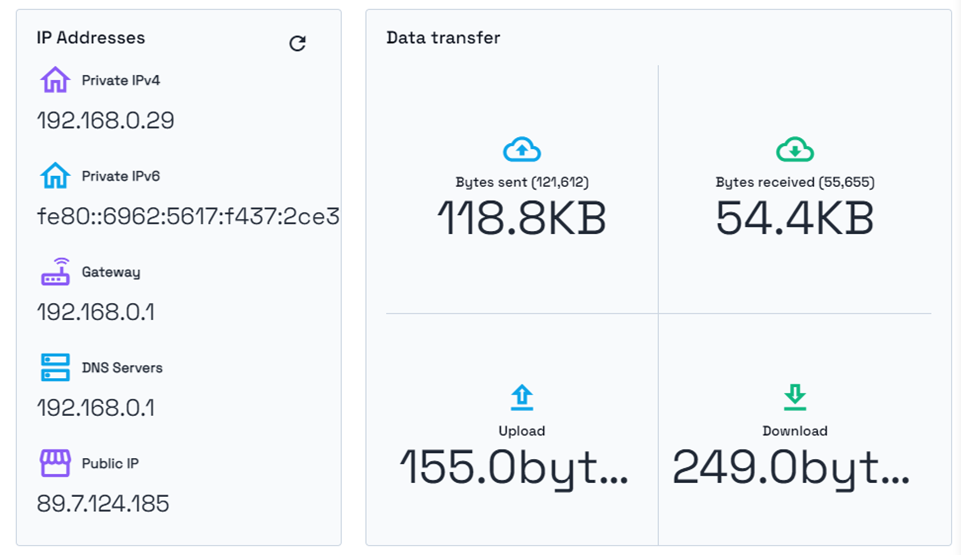
Starting with the IP address associated to the WiFi network, both private and public IPs, the gateway, and the DNS Servers. All of these are important parameters to detect misconfigurations that could impact the network connectivity. This is especially the case in corporate networks where the network range established by the AP could define which systems we have access to.
Data transfer statistics
This section also provides data transfer statistics: total number of bytes sent and received through the network. This is also helpful to detect connectivity problems by looking at the number of bytes transferred. In addition, the same section provides real time measurements for upload and download bandwidths, is not a direct solution to wifi problems, but troubleshooting it can reveal unwanted bandwidth consumption or applications that we did not know required high data consumption.
Performance (latency, packet loss and bandwidth)
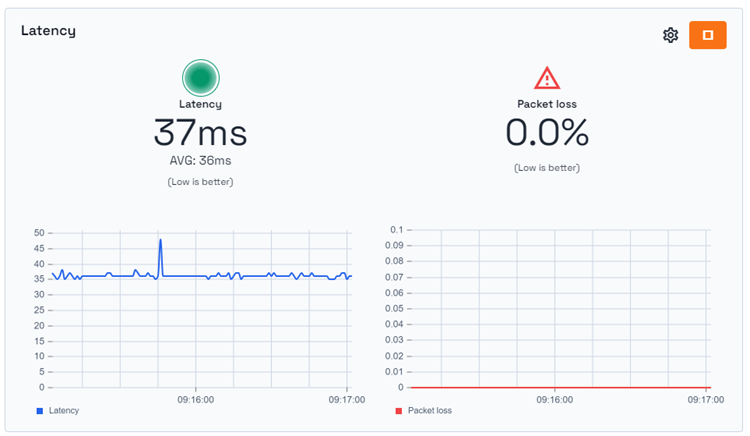
In these last cards the Windows wifi analyzer provides real WiFi performance measurements. The metrics used are latency, packet loss, bandwidth and roaming.
Latency and packet loss
Clicking on the wheel inside each card will open the configuration menu to define the Ping Server IP. A good choice is usually the Gateway IP, shown in the top cards of this section, which will measure with great accuracy the latency and packet loss of the WiFi network.
It is important to make a distinction between your WiFi network and the Internet. Having an excellent performance within your WiFi network does not necessarily mean a great connection to the Internet.
You can measure both by setting up two different IPs when measuring performance. If the network gateway IP is selected, the software will only measure the WiFi network performance. If you select an Internet ping server, you will measure both the WiFi performance and the performance of your ISP connection.
TIP: As an Internet ping server, you can put the IP address of virtually any web page, if you do not know how to get the IP of a page, it is as simple as opening a Windows console (cmd) and there put the command: nslookup www.lapaginaweb.com.
Bandwidth
Measuring bandwidth comes in two flavors: File download and Iperf server.
You can select a file to download from your intranet or from the Internet. The wifi analyzer will download the file repeatedly while measuring the bandwidth. This is a good option to measure real user experience bandwidth.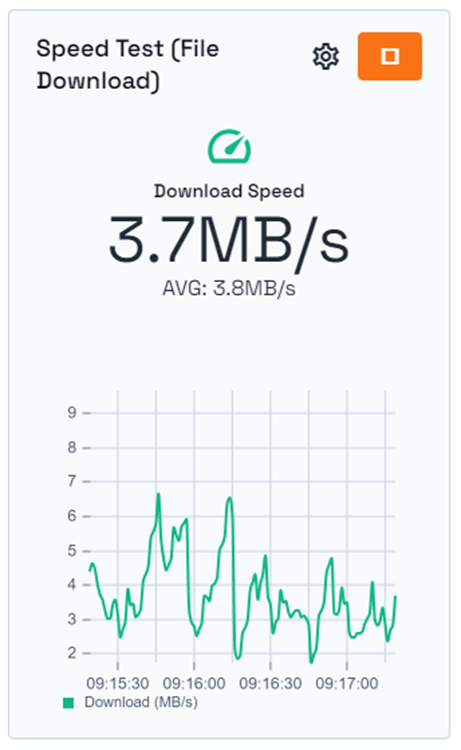
The second option, IPerf server, is the gold standard for bandwidth measurement. It is a server specifically designed to do this task. However,It is a server specifically designed to do this task and requires some more configuration because it needs the installation of an IPerf server inside the intranet. It is also possible to use one of the publicly available IPerf servers on the Internet, but this is highly discouraged as of the time of writing this article, all those servers show an unstable behavior and do not guarantee correct results when measuring connection performance so we could not use their data for measuring and troubleshooting wifi speed and download related problems.
The installation and execution of an IPerf server only requires downloading the executable file (exe) and executing the command iperf -s -p port. Even though it is not rocket science, getting the necessary permissions in some organizations may be harder than sending a rocket to the moon.
Lessons on why it is interesting to use a wifi analyzer for windows
We have seen how in an easy and simple way, with a wifi analyzer for Windows, without having high technical knowledge, we can measure the status of our network, which is its actual operation and obtain metrics and data that allow us to know if its performance is correct or if we can make changes or improvements in order to make it go as well as possible.
This article is part of a series of articles about Wifi troubleshooting and analysis
- Analyze and evaluate your wifi and Internet connection.
- Wifi network client and IP address, how to discover them, without monitor mode
- WiFi Report. How to generate a report of wifi networks ?
- wifi pcap on windows, Capture and storage of wireless traffic on windows 10
- Wifi analyzer, troubleshooting your WiFi from Windows
